Emissions reduction through efficient silage preservation
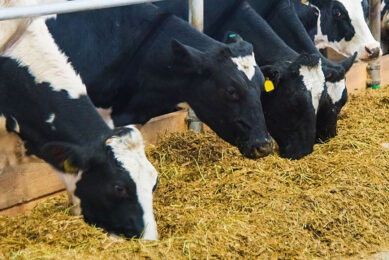
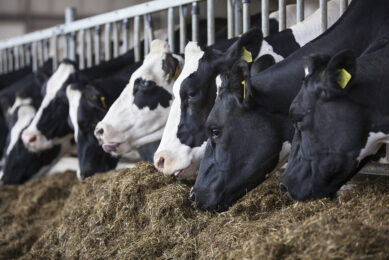
Dairy farming, a vital sector in the global agricultural landscape, is increasingly under scrutiny for its environmental footprint, particularly concerning greenhouse gas (GHG) emissions such as methane (CH4), carbon dioxide (CO2), and nitrous oxide (N2O). These emissions primarily arise from enteric fermentation in ruminants, the cultivation and preservation of feed crop, as well as manure management. To align with global sustainability goals and to reduce the environmental impact of dairy operations, farmers can adopt a multi-faceted approach including forage cropping, silage preparation and preservation, manure management, and waste reduction strategies.
In this article we take a deep dive into modulating emissions without adding extra steps to processing silage, but which have a considerable impact on the final carbon footprint as well as the bottom line.
Cost of carbon emissions in silage production
Transforming 1 kg CO2 equivalent (CO2e) per tonne of silage into monetary terms involves assigning a cost to the carbon emissions associated with silage production. This can be done by using a carbon price, which is the cost assigned per tonne of CO2 emitted. Carbon pricing can vary significantly depending on the region, market conditions, and the specific carbon pricing mechanism in place, such as carbon taxes or cap-and-trade systems.
1. Carbon price
Carbon prices can range from a few dollars to over US$50 per tonne of CO2e, depending on various factors. For this example, we will use a carbon price of US$40 per tonne of CO2e.
2. Cost of CO2 emissions per tonne of silage
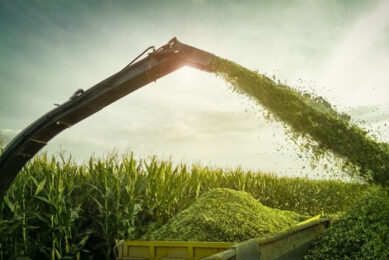
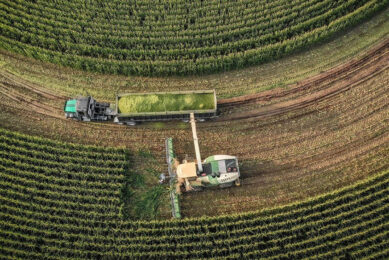
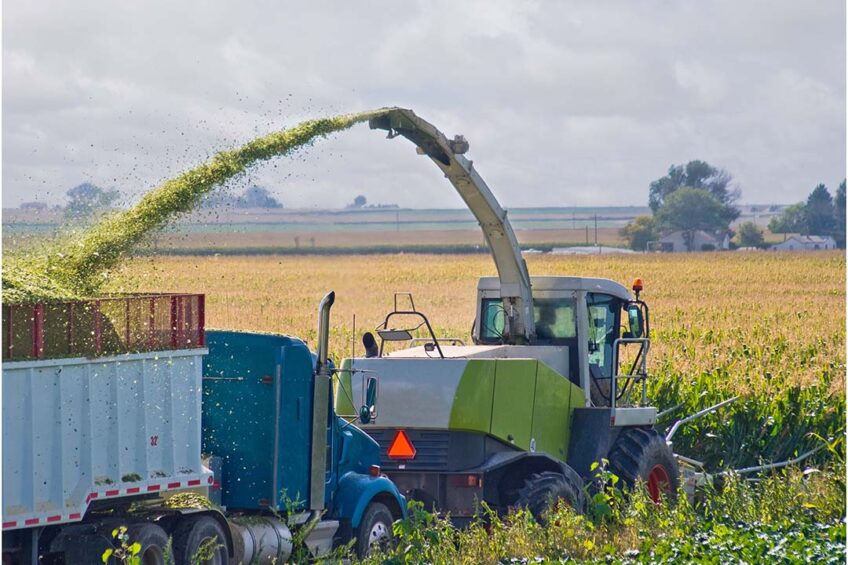
For simplicity, we will focus exclusively on the fuel consumption associated with harvesting and transporting the forage to the silo, an aspect that significantly contributes to the overall carbon footprint of silage production. These operations can vary widely in their fuel usage, but a conservative estimate would range between 15-35 litres of diesel per hectare.
Assuming 45 t/ha of corn silage, the fuel consumption translates into 1.15-2.50 kg of CO2 equivalent (CO2e) per tonne of silage produced, since the combustion of diesel fuel emits about 2.68 kg of CO2e per litre.
Harvesting and transportation emissions will be considered as per the calculation below:
35 litres/ha × 2.68 kg CO2e/litre = 93.80 kg CO2e/ha
Dry matter loss reduction: Using an effective silage inoculant reduces dry matter losses from more than 25% to about 10%. Although difficult to see, smell or directly quantify, dry matter savings can be calculated as they essentially describe the excess silage produced to account for the expected losses in the silage-making process, and they translate into reduced needs for forage acreage to meet the same feed requirements.
Emissions per tonne of silage produced: To calculate the emissions per tonne of silage, we need to distinguish between the forage yield from the field (DMHarvested), and the forage fed to the dairy cows after ensiling (DMFed). See Table 1 below.
In the above example, DMFed of the silage preserved with an effective inoculant comes with an increase in CO2 emissions of 15.75-14.18 t DM = 1.57 t DM x 5.95 kg CO2e/t DM equivalent to 9.26 kg CO2e.
For the untreated silage, the increase in CO2 emissions amounts to 15.75-11.81 t DM = 3.94 t DM x 5.95 CO2e/t DM which is equivalent to 23.44 kg CO2e or more than 2 times that of the inoculated silage.
If we look at the economic impact of using the carbon price of US$40 per tonne CO2e, the carbon cost of DMFed of untreated silage increases 23.44-9.26 kg CO2e = 14.18 kg CO2e x 40$/t CO2e or 0.56 $ per hectare.
This may not sound as much – but this is ‘only’ the difference in carbon footprint and assuming you can compensate the lost DM with own forage produced. If the DM lost must be replaced with compound feed, then the carbon footprint goes up. That said, keep in mind that the cost of corn silage can be 100-125 $/t DM – the difference in cost of DMFed of untreated silage will be 2.37 t DM, equivalent to 237-296 $/ha.
Magnitude of scale
For every 100 dairy cows, using a science-based, research-proven inoculant (that can effectively reduce dry matter losses) the required silage could be produced from 35 hectares of corn. Without inoculation, the requirement increases to 42 hectares, resulting in an additional 7 hectares for every 100 cows. With 25 million dairy cows in the EU, it is estimated that only 30% of the silage is inoculated. If all silage was corn, and 100% was inoculated, 1,225,000 hectares of land could be saved. That corresponds approximately to the size of Qatar!
Wrapping it up
Adding inoculants to silage is a win-win: reduction in DM loss works backwards as it means fewer hectares are required for forage production, less machinery burning less fuel, and less air pollution. Furthermore, when silage is top-notch, livestock are healthier and more productive. This means similar milk output emitting less methane, which is a real problem for the climate. Working smarter in dairy production is all about farming with tomorrow in mind.